The bullish divergence is raising hopes for a further rally. According to experts, if the Nifty 50 manages to extend its northward journey, the immediate hurdle is placed at 22,850. Sustaining above this level could open doors for the 23,000-23,200 zone. However, support is seen at 22,270.
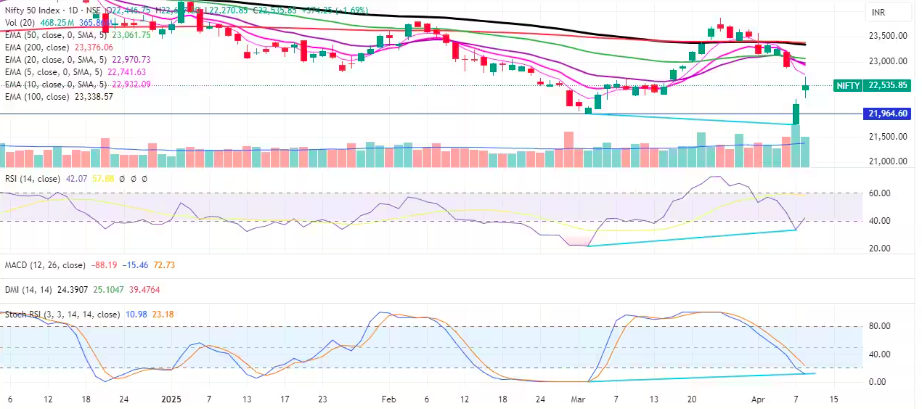
The market bounced back sharply after a day of severe correction, with the Nifty 50 rising 1.7 percent on April 8, following rallies in global peers and ahead of hopes for a repo rate cut by the RBI in its policy meeting scheduled for April 9. The index is still trading below all key moving averages, which is negative, along with an elevated VIX. However, a bullish divergence is raising hopes for a further rally. According to experts, if the index manages to extend its northward journey, the immediate hurdle is placed at 22,850 (the upper end of the bearish gap from April 7). Sustaining above this level could open doors for the 23,000-23,200 zone. However, support is seen at 22,270 (Tuesday’s low).
Here are 15 data points we have collated to help you spot profitable trades:
1) Key Levels For The Nifty 50 (22,536)
Resistance based on pivot points: 22,664, 22,765, and 22,928
Support based on pivot points: 22,338, 22,238, and 22,075
Special Formation: The Nifty 50 formed a bullish candlestick pattern with long upper and lower shadows, resembling a High Wave-like formation on the daily charts, signaling volatility. The index is still trading below all key moving averages (5, 10, 20, 50, 100, and 200-day EMAs), as well as below the midline of the Bollinger Bands, which is negative. However, there seems to be a bullish divergence, with the Nifty making a lower low and the RSI making a higher low, signaling the possibility of a further upward rally.
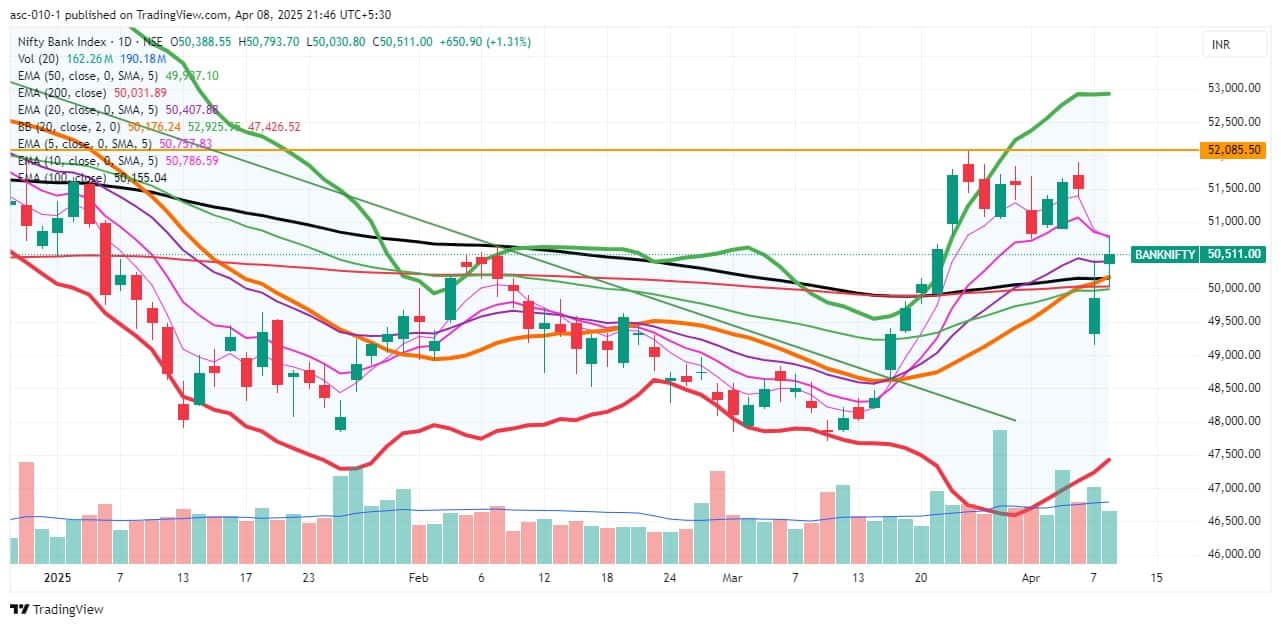
2) Key Levels For The Bank Nifty (50,511)
Resistance based on pivot points: 50,737, 50,917, and 51,208
Support based on pivot points: 50,154, 49,974, and 49,682
Resistance based on Fibonacci retracement: 50,593, 51,442
Support based on Fibonacci retracement: 49,883, 49,369
Special Formation: The Bank Nifty also formed a High Wave-like candlestick pattern on the daily timeframe while showing a higher high-higher low formation. With Tuesday’s rally, the index climbed above the midline of the Bollinger Bands, as well as above the 20, 50, 100, and 200-day EMAs in a single session, which is a positive sign. The RSI climbed above 50 and tilted upward on the daily charts, while the MACD still showed a positive crossover, though below the zero line on the weekly timeframe.
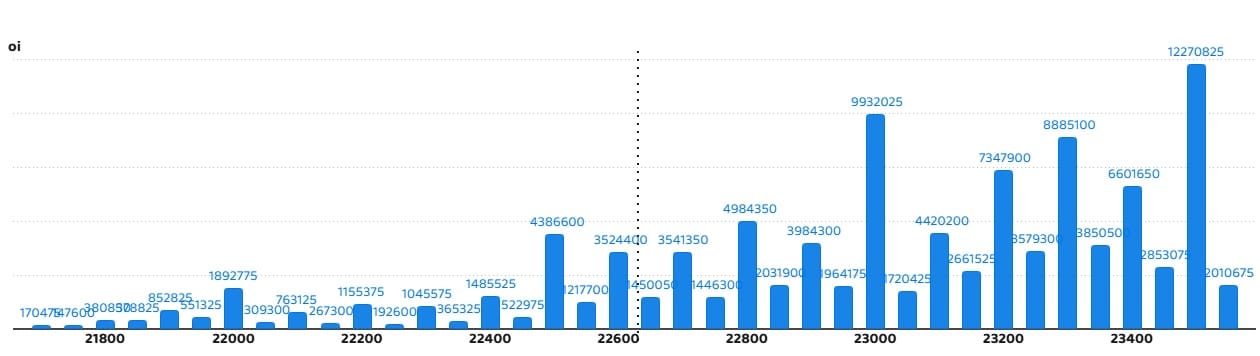
According to the weekly options data, the 23,500 strike holds the maximum Call open interest (with 1.22 crore contracts). This level can act as a key resistance for the Nifty in the short term. It was followed by the 23,000 strike (99.32 lakh contracts), and the 23,300 strike (88.85 lakh contracts).
Maximum Call writing was observed at the 23,400 strike, which saw an addition of 24.26 lakh contracts, followed by the 23,300 and 23,500 strikes, which added 20.27 lakh and 18.12 lakh contracts, respectively. The maximum Call unwinding was seen at the 22,000 strike, which shed 31.1 lakh contracts, followed by 22,700 and 22,200 strikes, which shed 21.75 lakh and 13.74 lakh contracts, respectively.
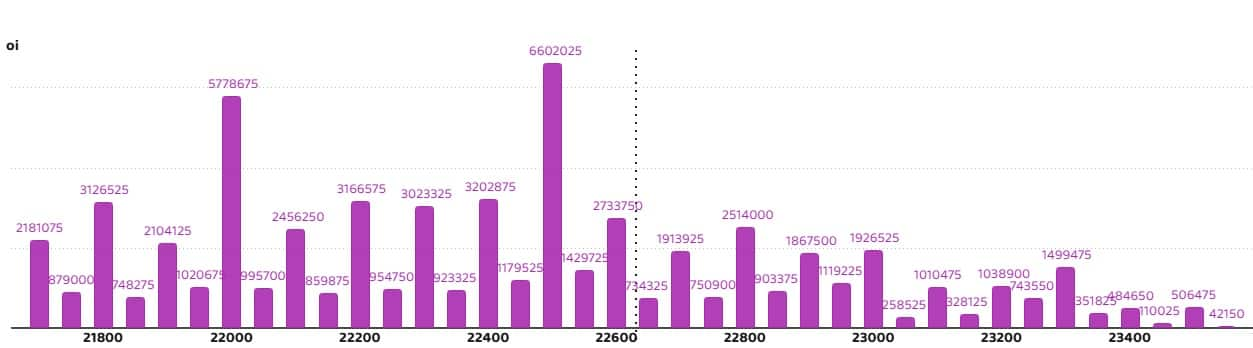
On the Put side, the maximum Put open interest was seen at the 22,500 strike (with 66.02 lakh contracts), which can act as a key support level for the Nifty. It was followed by the 22,000 strike (57.78 lakh contracts) and the 22,400 strike (32.02 lakh contracts).
The maximum Put writing was placed at the 22,500 strike, which saw an addition of 44.13 lakh contracts, followed by the 22,400 and 22,300 strikes, which added 21.92 lakh and 18.55 lakh contracts, respectively. The maximum Put unwinding was seen at the 22,000 strike, which shed 19.43 lakh contracts, followed by the 22,800 and 23,000 strikes, which shed 15.08 lakh and 8.96 lakh contracts, respectively.
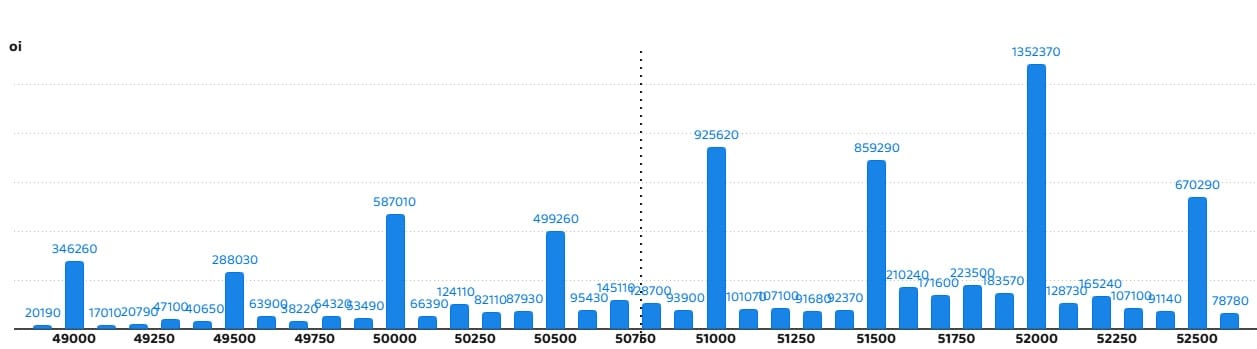
5) Bank Nifty Call Options Data
According to the monthly options data, the maximum Call open interest was seen at the 52,000 strike, with 13.52 lakh contracts. This can act as a key resistance level for the index in the short term. It was followed by the 51,000 strike (9.25 lakh contracts) and the 51,500 strike (8.59 lakh contracts).
Maximum Call writing was visible at the 50,700 strike (with the addition of 86,850 contracts), followed by the 52,500 strike (77,340 contracts) and the 50,500 strike (77,100 contracts). The maximum Call unwinding was seen at the 50,000 strike, which shed 1.31 lakh contracts, followed by the 49,500 and 49,000 strikes, which shed 29,820 and 24,600 contracts, respectively.
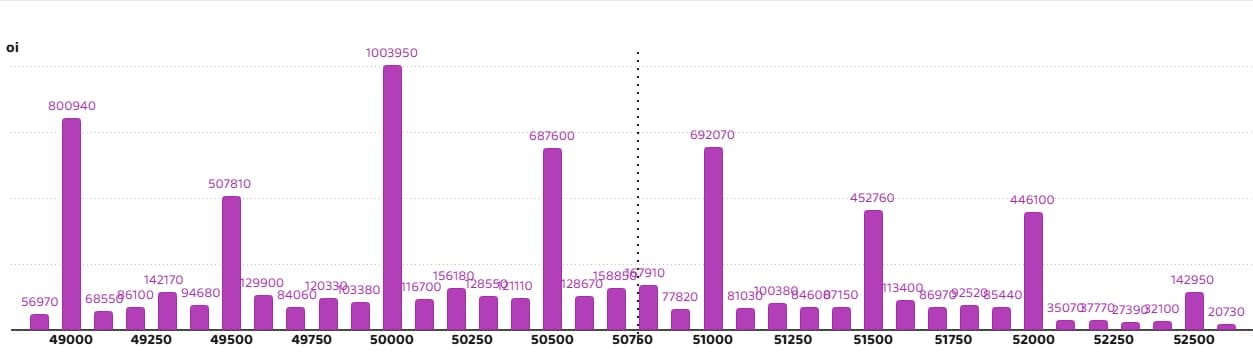
6) Bank Nifty Put Options Data
On the Put side, the 50,000 strike holds the maximum Put open interest (with 10.03 lakh contracts), which can act as a key support level for the index. This was followed by the 49,000 strike (8 lakh contracts) and the 51,000 strike (6.92 lakh contracts).
The maximum Put writing was observed at the 50,500 strike (which added 2.97 lakh contracts), followed by the 50,700 strike (1.05 lakh contracts) and the 50,800 strike (79,590 contracts). The maximum Put unwinding was seen at the 50,000 strike, which shed 80,880 contracts, followed by the 50,100 and 49,000 strikes, which shed 41,010 and 35,610 contracts, respectively.
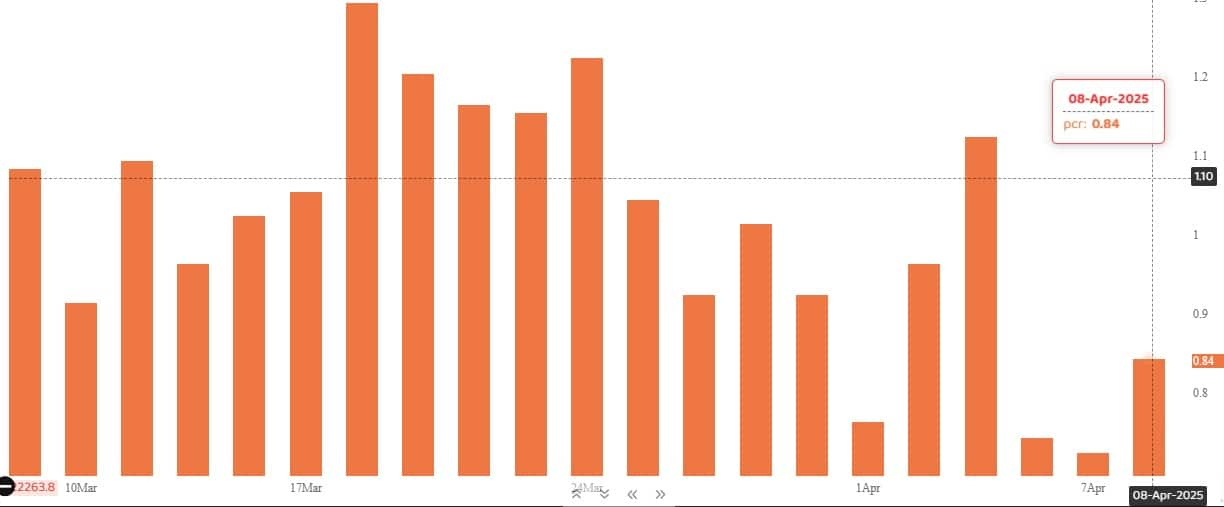
The Nifty Put-Call ratio (PCR), which indicates the mood of the market, rose to 0.84 on April 8, against 0.72 in the previous session.
The increasing PCR, or being higher than 0.7 or surpassing 1, means traders are selling more Put options than Call options, which generally indicates the firming up of a bullish sentiment in the market. If the ratio falls below 0.7 or moves towards 0.5, then it indicates selling in Calls is higher than selling in Puts, reflecting a bearish mood in the market.
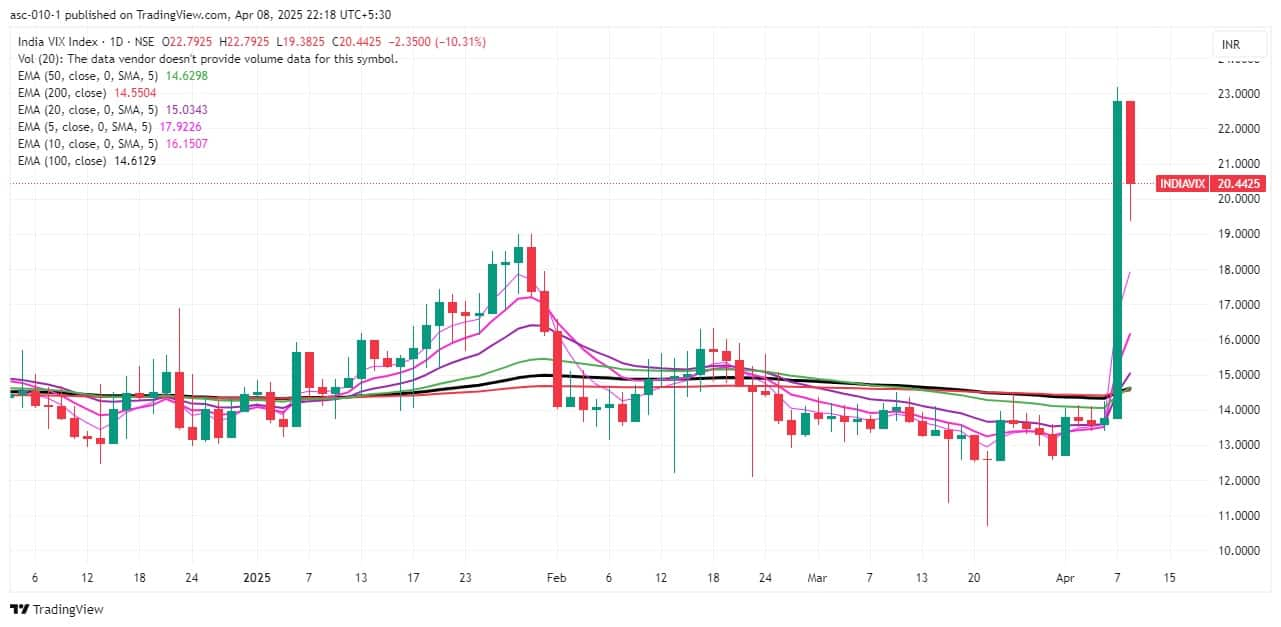
9) India VIX
The India VIX, which measures expected market volatility, dropped 10.31 percent to 20.44 levels after a 65.7 percent spike in previous single session. However, it remained at elevated levels, so caution should still be maintained in the bulls’ camp.
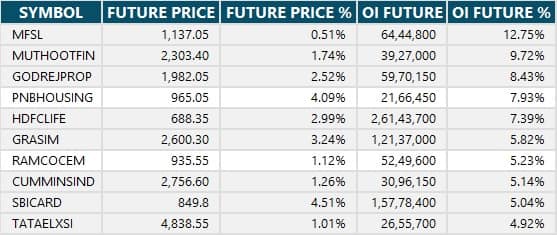
10) Long Build-up (110 Stocks)
A long build-up was seen in 110 stocks. An increase in open interest (OI) and price indicates a build-up of long positions.
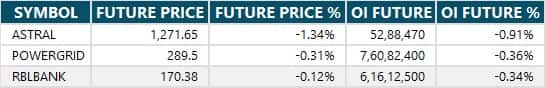
3 stocks saw a decline in open interest (OI) along with a fall in price, indicating long unwinding.
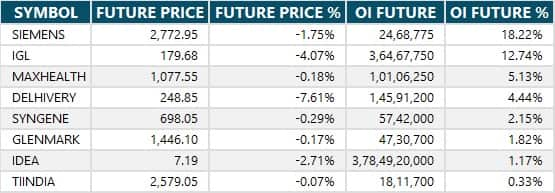
8 stocks saw an increase in OI along with a fall in price, indicating a build-up of short positions.
13) Short-Covering (101 Stocks)
101 stocks saw short-covering, meaning a decrease in OI, along with a price increase.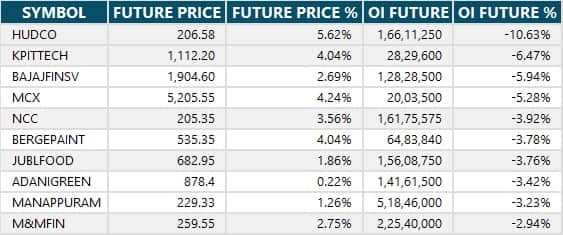
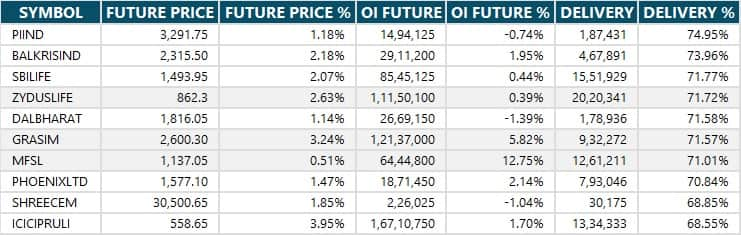
Here are the stocks that saw a high share of delivery trades. A high share of delivery reflects investing (as opposed to trading) interest in a stock.
Securities banned under the F&O segment include companies where derivative contracts cross 95 percent of the market-wide position limit.
Stocks added to F&O ban: Nil
Stocks retained in F&O ban: Birlasoft, Hindustan Copper, Manappuram Finance
Stocks removed from F&O ban: Nil
Source: www.moneycontrol.com
